POSTS
MRMCDCTF2019: ElizeVC Uncrypter
Solution to ElizeVC (Part II): Reconstructing the original binary
This is the second part of the solution to ElizeVC, one of my challenges for this years MRMCDCTF. In the first part I explained how to get the flag without actually attacking the crypter. Here I will focus on how to defeat the protector and reconstruct the original binary (at least the interesting parts) from the encrypted file.
The Protection
The protector encrypts every function on its own (as opposed to, for example, the complete .text segment).
Once a protected function is entered, a small code stub redirects execution to the decryption code.
This code decrypts the function at its original location and calls it.
Upon return, the function is encrypted again.
If a protected function calls another protected function, the decrypter re-encrypts the caller function before decrypting the callee. Therefore at any given time there is at most one protected function unencrypted in memory.
There are some other measures in place to make analysing or modifying the decryption stub harder (see part one for details).
Of interest here is only the ptrace based debugger check, which can be disabled with a syscall catchpoint.
gef➤  catch syscall ptrace
Abfangpunkt 1 (syscall 'ptrace' [101])
gef➤  commands
Type commands for breakpoint(s) 1, one per line.
End with a line saying just "end".
>set $rax = 0
>c
>end
Manual dumping
In part one we already stumbled upon various unencrypeted functions using breakpoints and memory watchpoints.
We will now look for a more systematic way to search for them, staring at main.
The main of the elize binary is quite simple:
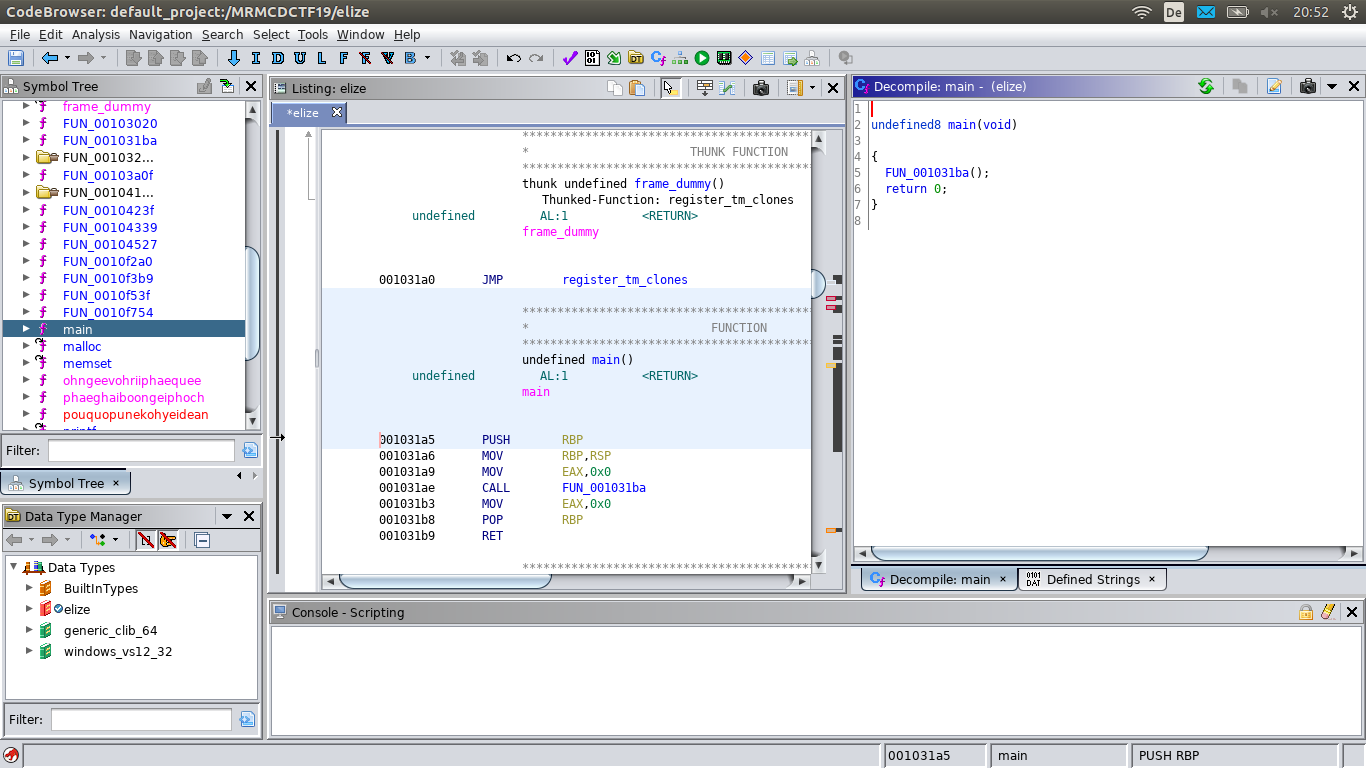
undefined8 main(void)
{
  FUN_001031ba();
  return 0;
}
The function FUN_001031ba is different:
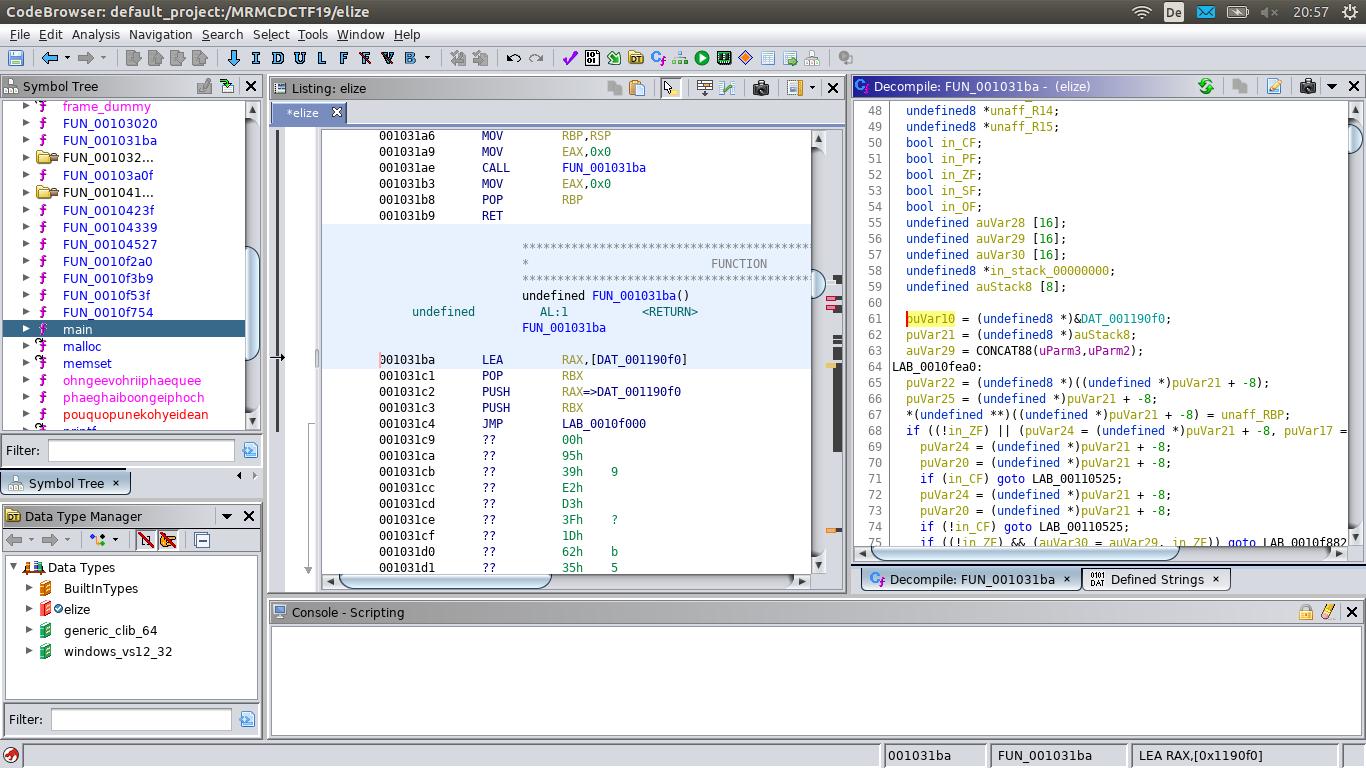
The decompiler output here is misleading: in the disassembler windows we see that the there are only five instructions followed by data. The decompiler misinterprets the jump as a continuation of the function, and tries to decompile the (obfuscated) decrypter.
But we have seen these five instructions before: in Part One we found out that a function, that on disk and at startup looks like this:
gef➤  x/30i 0x555555557220
   0x555555557220:	lea    eax,[rip+0x15dea]        # 0x55555556d010
   0x555555557226:	pop    rbx
   0x555555557227:	push   rax
   0x555555557228:	push   rbx
   0x555555557229:	jmp    0x555555563000
   0x55555555722e:	add    BYTE PTR [rax],bh
   0x555555557230:	imul   esp,edx,0x37ee45b6
   0x555555557236:	push   0x36
   0x555555557238:	jge    0x555555557219
   0x55555555723a:	iret
   0x55555555723b:	jae    0x5555555572b9
   0x55555555723d:	loop   0x55555555724b
   0x55555555723f:	(bad)
[...]
…at some later time turns to this:
gef➤  x/30i 0x555555557220
   0x555555557220:	mov    rbp,rsp
   0x555555557223:	sub    rsp,0x10
   0x555555557227:	mov    eax,0x0
   0x55555555722c:	call   0x55555555823f <tohtaapixohliboifuje+190>
   0x555555557231:	mov    edi,0x100
   0x555555557236:	call   0x555555557080 <malloc@plt>
   0x55555555723b:	mov    QWORD PTR [rbp-0x8],rax
   0x55555555723f:	mov    rax,QWORD PTR [rbp-0x8]
[...]
So it’s not a far fetched guess that FUN_001031ba might later on be replaced by a plaintext version of itself.
The logical next step is to set a hardware breakpoint at the first instruction of FUN_001031ba and wait until the decrypted function gets executed.
This is what I do here (much gdb/gef output removed for readability):
user@host$ gdb ./elize
GNU gdb (Ubuntu 8.2.91.20190405-0ubuntu3) 8.2.91.20190405-git
[...]
gef➤  catch syscall ptrace
Abfangpunkt 1 (syscall 'ptrace' [101])
gef➤  commands
Type commands for breakpoint(s) 1, one per line.
End with a line saying just "end".
>set $rax = 0
>c
>end

gef➤  b _start
Haltepunkt 2 at 0x30c0
gef➤  r
[...]
gef➤  disassemble main
Dump of assembler code for function main:
   0x00005555555571a5 <+0>:	push   rbp
   0x00005555555571a6 <+1>:	mov    rbp,rsp
   0x00005555555571a9 <+4>:	mov    eax,0x0
   0x00005555555571ae <+9>:	call   0x5555555571ba
   0x00005555555571b3 <+14>:	mov    eax,0x0
   0x00005555555571b8 <+19>:	pop    rbp
   0x00005555555571b9 <+20>:	ret
End of assembler dump.
gef➤  hbreak *0x5555555571ba
Hardwaregestützter Haltepunkt 3 at 0x5555555571ba
gef➤  c
Continuing.
[...]
────────────────────────────────────────────────────────── code:x86:64 ────
   0x5555555571b2 <main+13>        add    BYTE PTR [rax+0x0], bh
   0x5555555571b8 <main+19>        pop    rbp
   0x5555555571b9 <main+20>        ret
 → 0x5555555571ba                  lea    rax, [rip+0x15f2f]        # 0x55555556d0f0
   0x5555555571c1                  pop    rbx
   0x5555555571c2                  push   rax
   0x5555555571c3                  push   rbx
   0x5555555571c4                  jmp    0x555555563000
   0x5555555571c9                  add    BYTE PTR [rbp+0x3fd3e239], dl
──────────────────────────────────────────────────────────────── trace ────
[#0] 0x5555555571ba → lea rax, [rip+0x15f2f]        # 0x55555556d0f0
[#1] 0x5555555571b3 → main()
───────────────────────────────────────────────────────────────────────────
gef➤  c
Continuing.

Catchpoint 1 (call to syscall ptrace), 0x000055555556323e in ?? ()

Catchpoint 1 (returned from syscall ptrace), 0x000055555556323e in ?? ()

Breakpoint 3, 0x00005555555571ba in ?? ()
[...]
────────────────────────────────────────────────────────── code:x86:64 ────
   0x5555555571b2 <main+13>        add    BYTE PTR [rax+0x0], bh
   0x5555555571b8 <main+19>        pop    rbp
   0x5555555571b9 <main+20>        ret
 → 0x5555555571ba                  push   rbp
   0x5555555571bb                  mov    rbp, rsp
   0x5555555571be                  sub    rsp, 0x10
   0x5555555571c2                  mov    eax, 0x0
   0x5555555571c7                  call   0x55555555721f
   0x5555555571cc                  mov    QWORD PTR [rbp-0x10], rax
──────────────────────────────────────────────────────────────── trace ────
[#0] 0x5555555571ba → push rbp
[#1] 0x55555556358a → jne 0x5555555632ad
[#2] 0x5555555585b0 → tohtaapixohliboifuje()
[#3] 0x7ffff7bc5b6b → __libc_start_main(main=0x5555555571a5 <main>, argc=0x1, argv=0x7fffffffdaf8, init=<optimized out>, fini=<optimized out>, rtld_fini=<optimized out>, stack_end=0x5555555571a5 <main>)
───────────────────────────────────────────────────────────────────────────
gef➤
Success!
We have set a hardware breakpoint on FUN_001031ba, and let the program continue.
At the first hit to the breakpoint the function was still in its encrypted stage.
But later, at the second hit, we find it in its clear text form.
Here is the complete function:
gef➤  x/28i 0x5555555571ba
=> 0x5555555571ba:	push   rbp
   0x5555555571bb:	mov    rbp,rsp
   0x5555555571be:	sub    rsp,0x10
   0x5555555571c2:	mov    eax,0x0
   0x5555555571c7:	call   0x55555555721f
   0x5555555571cc:	mov    QWORD PTR [rbp-0x10],rax
   0x5555555571d0:	mov    rax,QWORD PTR [rbp-0x10]
   0x5555555571d4:	mov    rdi,rax
   0x5555555571d7:	call   0x555555558187 <tohtaapixohliboifuje+6>
   0x5555555571dc:	mov    eax,0x0
   0x5555555571e1:	call   0x555555557a0f <ahngashifaisuethooqu+289>
   0x5555555571e6:	mov    QWORD PTR [rbp-0x8],rax
   0x5555555571ea:	mov    rcx,QWORD PTR [rbp-0x8]
   0x5555555571ee:	mov    rax,QWORD PTR [rbp-0x10]
   0x5555555571f2:	mov    edx,0x100
   0x5555555571f7:	mov    rsi,rcx
   0x5555555571fa:	mov    rdi,rax
   0x5555555571fd:	call   0x5555555581e7 <tohtaapixohliboifuje+102>
   0x555555557202:	test   eax,eax
   0x555555557204:	jne    0x555555557212
   0x555555557206:	mov    eax,0x0
   0x55555555720b:	call   0x555555558339 <tohtaapixohliboifuje+440>
   0x555555557210:	jmp    0x55555555721c
   0x555555557212:	mov    eax,0x0
   0x555555557217:	call   0x555555558527 <tohtaapixohliboifuje+934>
   0x55555555721c:	nop
   0x55555555721d:	leave
   0x55555555721e:	ret
We can now dump this function, and try to replace the encrypted function in the binary file with our decrypted one:
First we dump FUN_001031ba to the file FUN_001031ba.dump.
Then we get some information about this memory location.
gef➤  dump memory FUN_001031ba.dump 0x5555555571ba 0x55555555721f
gef➤  xinfo 0x5555555571ba
────────────────────────── xinfo: 0x5555555571ba ──────────────────────────
Page: 0x0000555555557000  →  0x0000555555558000 (size=0x1000)
Permissions: r-x
Pathname: /[...]/elize
Offset (from page): 0x1ba
Inode: 21763258
Segment: .text (0x00005555555570c0-0x0000555555558611)
gef➤  vmmap elize
Start              End                Offset             Perm Path
0x0000555555554000 0x0000555555557000 0x0000000000000000 r-- /[...]/elize
0x0000555555557000 0x0000555555558000 0x0000000000003000 r-x /[...]/elize
0x0000555555558000 0x0000555555559000 0x0000000000004000 r-x /[...]/elize
0x0000555555559000 0x000055555555a000 0x0000000000005000 r-- /[...]/elize
0x000055555555a000 0x000055555555b000 0x0000000000005000 r-- /[...]/elize
0x000055555555b000 0x000055555555c000 0x0000000000006000 rw- /[...]/elize
0x0000555555563000 0x0000555555565000 0x0000000000007000 r-x /[...]/elize
0x000055555556d000 0x000055555556e000 0x0000000000009000 rw- /[...]/elize
We now have the functions code in a file.
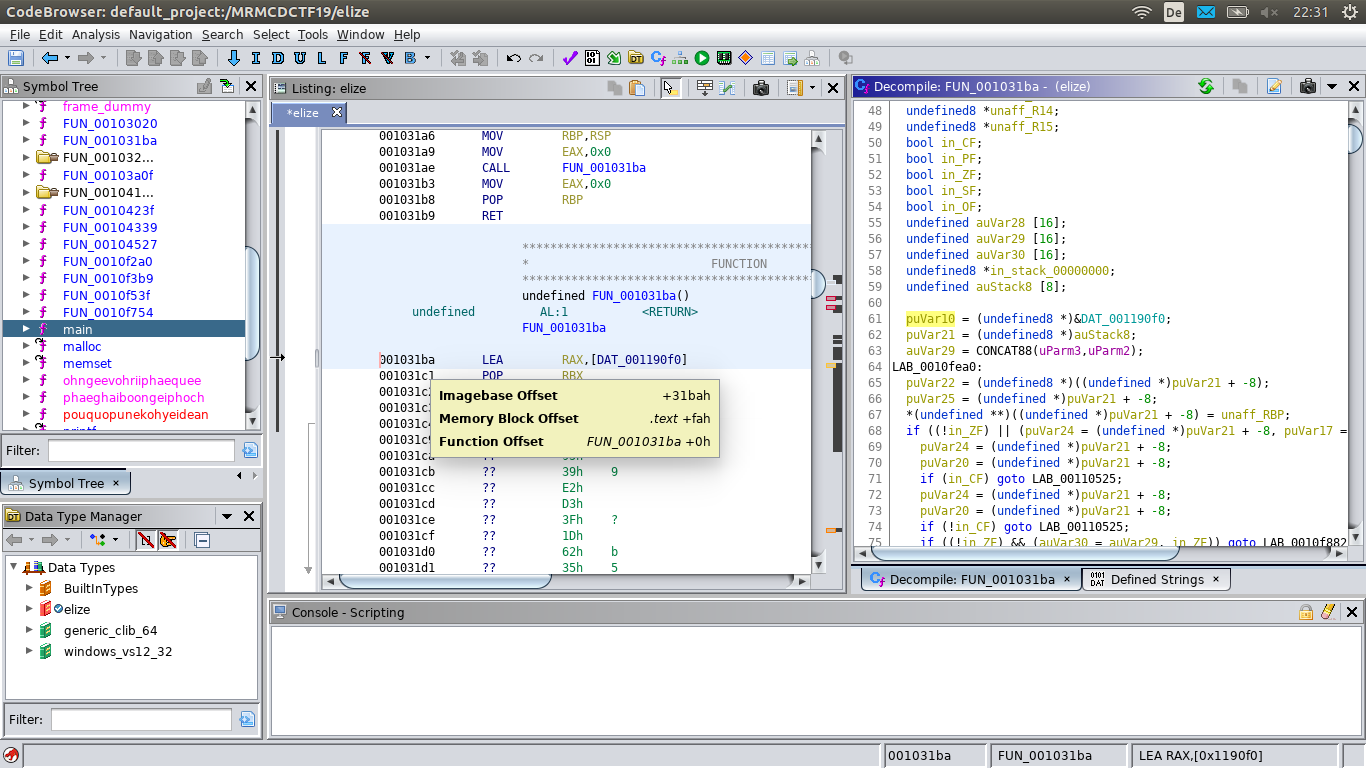
We also know that the function is at offset 0x1ba in page 0x555555557000, which is loaded from the file offset 0x3000.
So the function is located at offset 0x31ba in the file.
You can get the same information by hovering the mouse over the address in ghidra.
We then copy the dumped function to the right offset of the binary and test it:
user@host$ cp elize elize_fixed_FUN_001031ba
user@host$ dd if=FUN_001031ba.dump of=elize_fixed_FUN_001031ba bs=1 count=101 seek=$((0x31ba)) conv=notrunc
101+0 Datensätze ein
101+0 Datensätze aus
101 Bytes kopiert, 0,00136937 s, 73,8 kB/s
user@host$ ./elize_fixed_FUN_001031ba
The password is the flag. What is the password?
(The file can be found here)
Update 11.12.2019:
I have written two ghidra scripts that make this process less cumbersome:
WriteBlob makes it possible to replace the function directly in ghidra, and SavePatch
allows you to write the changes back to the executable.
This should be somewhat more convenient that patching the binary with dd. End of update.
Since the file with the reconstructed function works just fine, we can infer that there is no further integrity check in the protector.
And ghidra can now decompile the formerly protected function:
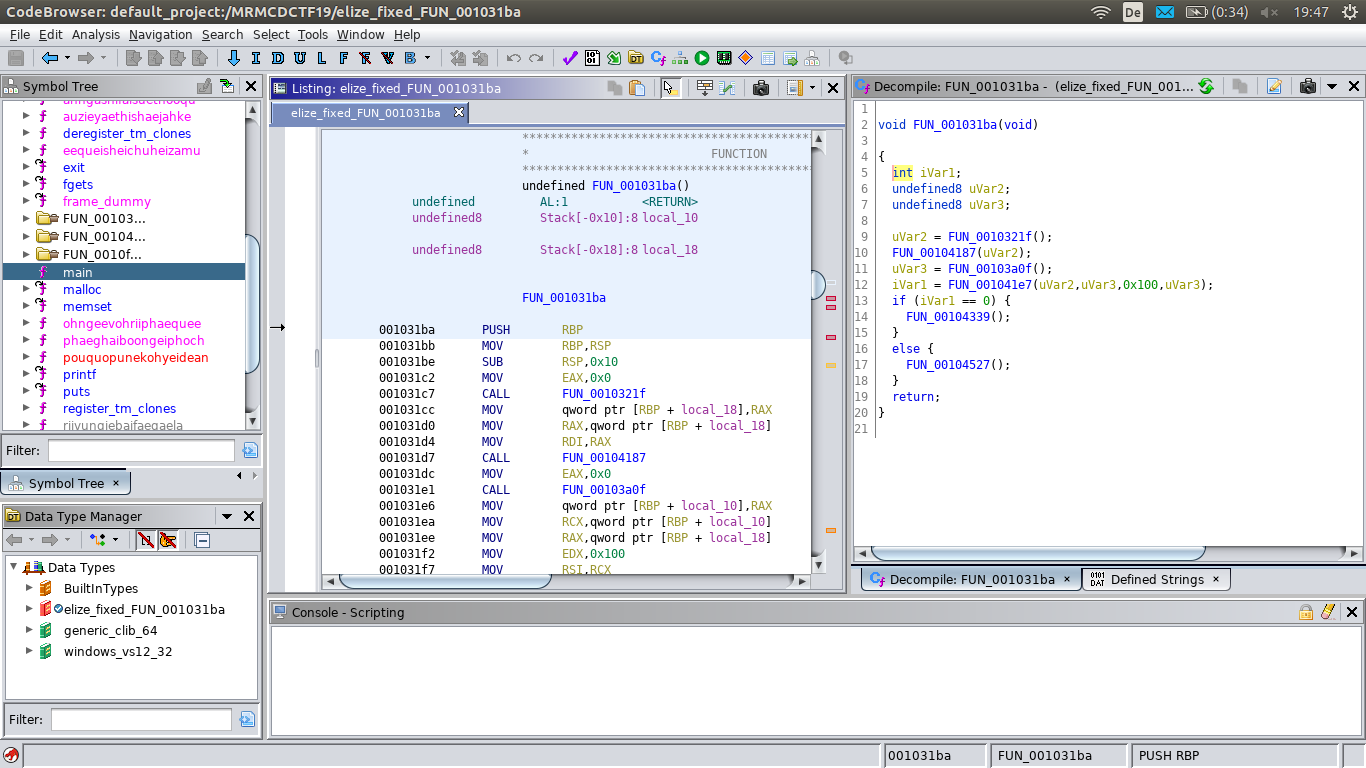
void FUN_001031ba(void)
{
  int iVar1;
  undefined8 uVar2;
  undefined8 uVar3;

  uVar2 = FUN_0010321f();
  FUN_00104187(uVar2);
  uVar3 = FUN_00103a0f();
  iVar1 = FUN_001041e7(uVar2,uVar3,0x100,uVar3);
  if (iVar1 == 0) {
    FUN_00104339();
  }
  else {
    FUN_00104527();
  }
  return;
}
The sad thing is: it does not help us that much.
It calls some other functions, but all of them are still encrypted.
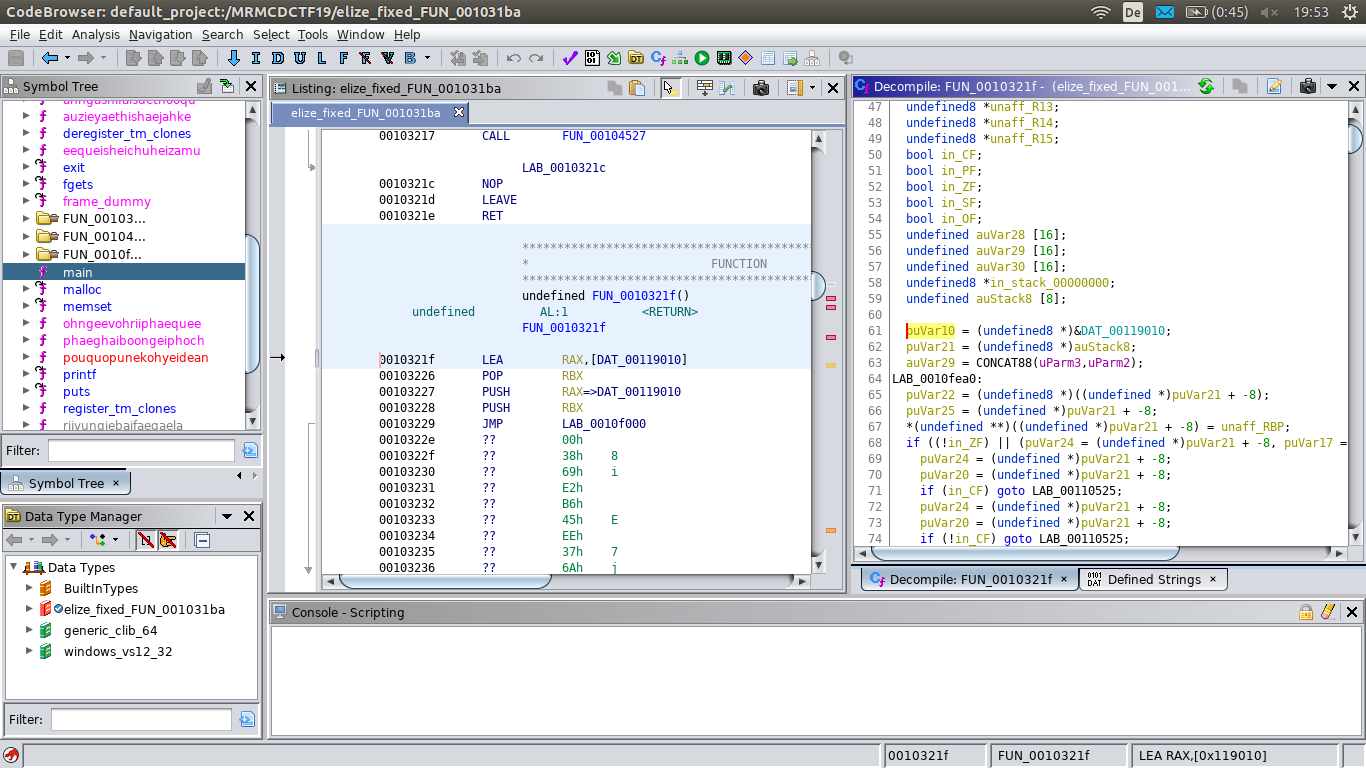
But we have an approach that works on one function, and it can work on all others as well!
Step by step:
- Identify a protected function:
Each protected function starts with five instructions, the last one being
JMP LAB_0010f000. The rest is just gibberish. - In the debugger, set a hardware breakpoint on the start of the function.
- When the breakpoint is hit for the first time, the function is still encryped. But the stub that’s executed now will jump to the decryption routine soon. Let the execution continue.
- When the breakpoint is hit for the second time, we now have the decrypted function before us. Dump it to a file.
- Get the offset of the function in the file on disk.
- Copy the decrypted function over the encrypted function in the file (using
ddor similar tools).
The functions FUN_0010321f, FUN_00104187, FUN_00103a0f, FUN_001041e7, FUN_00104339 and FUN_00104527 are already visible in the decompiled FUN_001031ba.
Lets start with FUN_0010321f, located in memory at 0x55555555721f (most of the gdb/gef output removed for readability):
user@host:$ gdb ./elize_fixed_FUN_001031ba
[...]
gef➤  catch syscall ptrace
Abfangpunkt 1 (syscall 'ptrace' [101])
gef➤  commands
Type commands for breakpoint(s) 1, one per line.
End with a line saying just "end".
>set $rax=0
>c
>end
gef➤  start
[...]
gef➤  hbreak *0x55555555721f
Hardwaregestützter Haltepunkt 2 at 0x55555555721f
gef➤  c
Continuing.

Breakpoint 2, 0x000055555555721f in ?? ()
[...]
─────────────────────────────────────────────────────────────────── code:x86:64 ────
   0x55555555721c                  nop
   0x55555555721d                  leave
   0x55555555721e                  ret
 → 0x55555555721f                  lea    rax, [rip+0x15dea]        # 0x55555556d010
   0x555555557226                  pop    rbx
   0x555555557227                  push   rax
   0x555555557228                  push   rbx
   0x555555557229                  jmp    0x555555563000
   0x55555555722e                  add    BYTE PTR [rax], bh
───────────────────────────────────────────────────────────────────────── trace ────
[#0] 0x55555555721f → lea rax, [rip+0x15dea]        # 0x55555556d010
[#1] 0x5555555571cc → mov QWORD PTR [rbp-0x10], rax
[#2] 0x5555555571b3 → main()
────────────────────────────────────────────────────────────────────────────────────
gef➤  c
Continuing.

Catchpoint 1 (call to syscall ptrace), 0x000055555556323e in ?? ()

Catchpoint 1 (returned from syscall ptrace), 0x000055555556323e in ?? ()

Breakpoint 2, 0x000055555555721f in ?? ()
[...]
─────────────────────────────────────────────────────────────────── code:x86:64 ────
   0x55555555721c                  nop
   0x55555555721d                  leave
   0x55555555721e                  ret
 → 0x55555555721f                  push   rbp
   0x555555557220                  mov    rbp, rsp
   0x555555557223                  sub    rsp, 0x10
   0x555555557227                  mov    eax, 0x0
   0x55555555722c                  call   0x55555555823f <tohtaapixohliboifuje+190>
   0x555555557231                  mov    edi, 0x100
───────────────────────────────────────────────────────────────────────── trace ────
[#0] 0x55555555721f → push rbp
[#1] 0x55555556358a → jne 0x5555555632ad
[#2] 0x5555555585b0 → tohtaapixohliboifuje()
[#3] 0x5555555570c0 → xor ebp, ebp
[#4] 0x7fffffffdac0 → mov al, 0x85
[#5] 0x5555555571b3 → main()
────────────────────────────────────────────────────────────────────────────────────
gef➤  x/30i 0x55555555721f
=> 0x55555555721f:	push   rbp
   0x555555557220:	mov    rbp,rsp
   0x555555557223:	sub    rsp,0x10
   0x555555557227:	mov    eax,0x0
   0x55555555722c:	call   0x55555555823f <tohtaapixohliboifuje+190>
   0x555555557231:	mov    edi,0x100
   0x555555557236:	call   0x555555557080 <malloc@plt>
   0x55555555723b:	mov    QWORD PTR [rbp-0x8],rax
   0x55555555723f:	mov    rax,QWORD PTR [rbp-0x8]
   0x555555557243:	mov    edx,0x100
   0x555555557248:	mov    esi,0x0
   0x55555555724d:	mov    rdi,rax
   0x555555557250:	call   0x555555557060 <memset@plt>
   0x555555557255:	cmp    QWORD PTR [rbp-0x8],0x0
   0x55555555725a:	jne    0x555555557266
   0x55555555725c:	mov    edi,0xffffffff
   0x555555557261:	call   0x5555555570a0 <exit@plt>
   0x555555557266:	mov    rdx,QWORD PTR [rip+0x3da3]        # 0x55555555b010 <stdin@@GLIBC_2.2.5>
   0x55555555726d:	mov    rax,QWORD PTR [rbp-0x8]
   0x555555557271:	mov    esi,0x100
   0x555555557276:	mov    rdi,rax
   0x555555557279:	call   0x555555557070 <fgets@plt>
   0x55555555727e:	mov    rax,QWORD PTR [rbp-0x8]
   0x555555557282:	lea    rsi,[rip+0x1d7b]        # 0x555555559004
   0x555555557289:	mov    rdi,rax
   0x55555555728c:	call   0x555555557090 <strtok@plt>
   0x555555557291:	mov    rax,QWORD PTR [rbp-0x8]
   0x555555557295:	leave
   0x555555557296:	ret
   0x555555557297:	lea    rax,[rip+0x15daa]        # 0x55555556d048
gef➤  dump memory 0x55555555721f.dmp 0x55555555721f 0x555555557297
This gives you the function in plain text in the file 0x55555555721f.dmp.
Ghidra tells us that the offset of the function in the file (Imagebase Offset) is 0x321f.
We then use dd to copy the 120 bytes of 0x55555555721f.dmp into the file elize_fixed at offset 0x321f without truncating the output file:
dd if=0x55555555721f.dmp of=elize_fixed bs=1 seek=$((0x321f)) count=120 conv=notrunc
The same procedure can be applied to all other functions.
The only exception is FUN_00104339, which never gets called unless the correct password was entered.
If you have dumped and patched all these functions, you will end up with a binary like this.
When you explore the file in ghidra, you will find some functions still encrypted (FUN_0010423f and FUN_00103297).
But you already know the drill, and you will end up with this.
You can now analysed the complete file with ghidra, just as if there never was a protection applied.
GDB script
Well, manual dumping works, but it’s kind of laborious to dump every function on its own. Also, while there where only a couple of protected functions here, such a process will quickly become impracticable for larger binary files with more functions. Is there no better way to do this?
Of course there is! We can use gdb’s python interface!
We could simply try to automate the steps taken for manual dumping, but there is a better and easier way to do it:
We know the ‘baseline’ form of the executable, with the protected function encrypted, from the beginning: it’s loaded in memory at process start. We further know that at various points in time, some encrypted functions are replaced by their decrypted versions, but never all at once (in fact, never more than one). But if we can stop the process later, we can easily identify if there is a decrypted function in memory: all we have to is to look for differences between the code at the time and the code at the start of the process (baseline). The bytes that differ are part of a (now decrypted) protected function, and can be saved for later use.
All we now need a a reliable way to trigger this process for every function that ever gets decrypted.
Here we can take advantage of the fact that the memory containing the code is not writable.
Therefore the decryption stub must change the memory permissions whenever it is rewriting a function.
To do this, it must use the mprotect syscall.
And it uses mprotect a lot, even after the startup of the process:
gef➤  b _start
Haltepunkt 1 at 0x30c0
gef➤  r
Breakpoint 1, 0x00005555555570c0 in _start ()
[...]
gef➤  catch syscall ptrace
Abfangpunkt 2 (syscall 'ptrace' [101])
gef➤  commands
Type commands for breakpoint(s) 2, one per line.
End with a line saying just "end".
>set $rax=0
>c
>end
gef➤  catch syscall mprotect
Abfangpunkt 3 (syscall 'mprotect' [10])
gef➤  commands
Type commands for breakpoint(s) 3, one per line.
End with a line saying just "end".
>c
>end
gef➤  c
Continuing.
Catchpoint 2 (call to syscall ptrace), 0x000055555556323e in ?? ()
Catchpoint 2 (returned from syscall ptrace), 0x000055555556323e in ?? ()
Catchpoint 3 (call to syscall mprotect), 0x00005555555636d5 in ?? ()
Catchpoint 3 (returned from syscall mprotect), 0x00005555555636d5 in ?? ()
Catchpoint 3 (call to syscall mprotect), 0x0000555555564318 in ?? ()
Catchpoint 3 (returned from syscall mprotect), 0x0000555555564318 in ?? ()
Catchpoint 3 (call to syscall mprotect), 0x0000555555564605 in ?? ()
Catchpoint 3 (returned from syscall mprotect), 0x0000555555564605 in ?? ()
Catchpoint 3 (call to syscall mprotect), 0x0000555555563a3b in ?? ()
Catchpoint 3 (returned from syscall mprotect), 0x0000555555563a3b in ?? ()
[ many more mprotect catchpoint hits ]
So here’s what we will do:
We take a snapshot of the interesting memory at process start (baseline).
Then, we let the process run, but stop it at every mprotect syscall.
We use this stop to compare the current memory with the saved baseline snapshot, and keep a copy of all changed bytes.
At the end we will have a copy of every protected function that got called during the execution.
The components
The scrip to execute this plan implements three custom commands for gdb:
monitor-codechange, to take the baseline snapshotmonitor-codechange-event, to search the memory for changesmonitor-dump, to dump the decrypted memory to a file
Lets take a closer look at each of them:
monitor-codechange
This commands takes the baseline snapshot that will later be used by monitor-codechange-event.
class MonitorCodechange(gdb.Command):
    def __init__ (self):
        super (MonitorCodechange, self).__init__ ("monitor-codechange", gdb.COMMAND_USER)

    def invoke (self, arg, from_tty):
        global start
        global size
        start, size = arg.split(" ")
        start = int(start,0)
        size = int(size,0)

        # get baseline
        inf = gdb.inferiors()[0]
        global baseline
        baseline = inf.read_memory(start,size)

        # initialise baseline copy
        global decrypted
        decrypted = inf.read_memory(start,size)
The __init__ method is boilerplate code to implement a new gdb command.
The invoke method is called whenever this new command is called by the debugger.
invoke first parses its command line parameters, the address of the memory to monitor and its size (without any error checks, it will just fail when called with anything other than an address and a size).
Then it gets the state of the debugged program, which in gdb is called an inferior, curiously. It creates two copies of the memory: one as the baseline to compare against, and one more as a working copy, which will be updated whenever a new decrypted function in found.
monitor-codechange-event
monitor-codechange-event is intended to be triggered by events during runtime.
It will do the comparison of the current memory with the baseline copy.
class MonitorCodechangeEvent(gdb.Command):
    def __init__ (self):
        super (MonitorCodechangeEvent, self).__init__ ("monitor-codechange-event", gdb.COMMAND_USER)

    def invoke (self, arg, from_tty):
        inf = gdb.inferiors()[0]
        current = inf.read_memory(start,size)

        global baseline
        global decrypted
        for i in range(size):
            if current[i] != baseline[i]:
                decrypted[i] = current[i]

        gdb.execute("c")
The function gets a copy of the monitored memory like monitor-codechange before.
Then it bytewise compares the current memory with the saved baseline.
Any change found means that there is a newly decrypted function in memory.
The working copy (called decrypted here) is updated, with the new decrypted function replacing the copy of the old encrypted function.
monitor-dump
monitor-dump is manually called at the end.
It exports the decrypted functions to a file.
class MonitorDump(gdb.Command):
    def __init__ (self):
        super (DumpDecrypted, self).__init__ ("monitor-dump", gdb.COMMAND_USER)
    def invoke (self, arg, from_tty):
        with open(arg,"wb") as f:
            f.write(decrypted.tobytes())
Once the program has run, the decrypted array will contain a copy of the monitored memory, but with all the originally encrypted functions replaced with their decrypted versions.
This function simply writes this memory to the given file name.
Combining the pieces
The complete script can be found here.
So how do we use it?
The plan is to run the challenge in the debugger until its startup is done.
Then we invoke monitor-codechange with the segment containing the encrypted functions to create the baseline snapshot.
We also create catchpoint on mprotect and set it up to call monitor-codechange-event on every hit, then continue.
Then we let the program continue.
After is is finished, we use monitor-dump to dump the copy of the segment with the decrypted functions to disk.
We will later paste this dump into the executable with dd, as we have done with the single functions before.
The script in combination with gef produces a lot of output.
I ran the script with a plain gdb and shortened it for better readability.
(gdb) catch syscall ptrace
Abfangpunkt 1 (syscall 'ptrace' [101])
(gdb) commands
Type commands for breakpoint(s) 1, one per line.
End with a line saying just "end".
>set $rax=0
>c
>end
(gdb) b _start
Haltepunkt 2 at 0x30c0
(gdb) r
Starting program: elize
[Thread debugging using libthread_db enabled]
Using host libthread_db library "/lib/x86_64-linux-gnu/libthread_db.so.1".
Breakpoint 2, 0x00005555555570c0 in _start ()
(gdb) source monitor_codechange.py
(gdb) monitor-codechange 0x0000555555557000 0x2000
(gdb) catch syscall mprotect
Abfangpunkt 3 (syscall 'mprotect' [10])
(gdb) commands
Type commands for breakpoint(s) 3, one per line.
End with a line saying just "end".
>monitor-codechange-event
>c
>end
(gdb) c
Continuing.
Catchpoint 1 (call to syscall ptrace), 0x000055555556323e in ?? ()
Catchpoint 1 (returned from syscall ptrace), 0x000055555556323e in ?? ()
Catchpoint 3 (call to syscall mprotect), 0x00005555555636d5 in ?? ()
Catchpoint 3 (returned from syscall mprotect), 0x00005555555636d5 in ?? ()
Catchpoint 3 (call to syscall mprotect), 0x0000555555564318 in ?? ()

[ many more catchpoint hits ]

Catchpoint 3 (returned from syscall mprotect), 0x0000555555564318 in ?? ()
The password is the flag. What is the password?

[ some more catchpoint hits ]

Catchpoint 3 (returned from syscall mprotect), 0x0000555555564318 in ?? ()
foobar
Catchpoint 3 (call to syscall mprotect), 0x0000555555564605 in ?? ()

[ still more catchpoint hits ]

Catchpoint 3 (returned from syscall mprotect), 0x0000555555564318 in ?? ()
Wrong. Try again.
Catchpoint 3 (call to syscall mprotect), 0x0000555555564605 in ?? ()

[ and a lot more chatchpoint hits ]

Catchpoint 3 (call to syscall mprotect), 0x0000555555563a3b in ?? ()
Catchpoint 3 (returned from syscall mprotect), 0x0000555555563a3b in ?? ()
[Inferior 1 (process 24412) exited normally]
(gdb) monitor-dump out.dmp
Now we have a memory dump of the code segment, but with all the functions that got executed during the run in decrypted form.
We now paste the dumped code it into the binary and check if it runs like expected.
user@host:$ dd if=out.dmp of=elize bs=1 count=$((0x2000)) seek=$((0x3000)) conv=notrunc
8192+0 Datensätze ein
8192+0 Datensätze aus
8192 Bytes (8,2 kB, 8,0 KiB) kopiert, 0,0205774 s, 398 kB/s
user@host:$ ./elize
The password is the flag. What is the password?
foobar
Wrong. Try again.
Works like the original binary.
But when you open it in ghidra, you will find all important functions unencrypted, just like with the manual dumped binary.
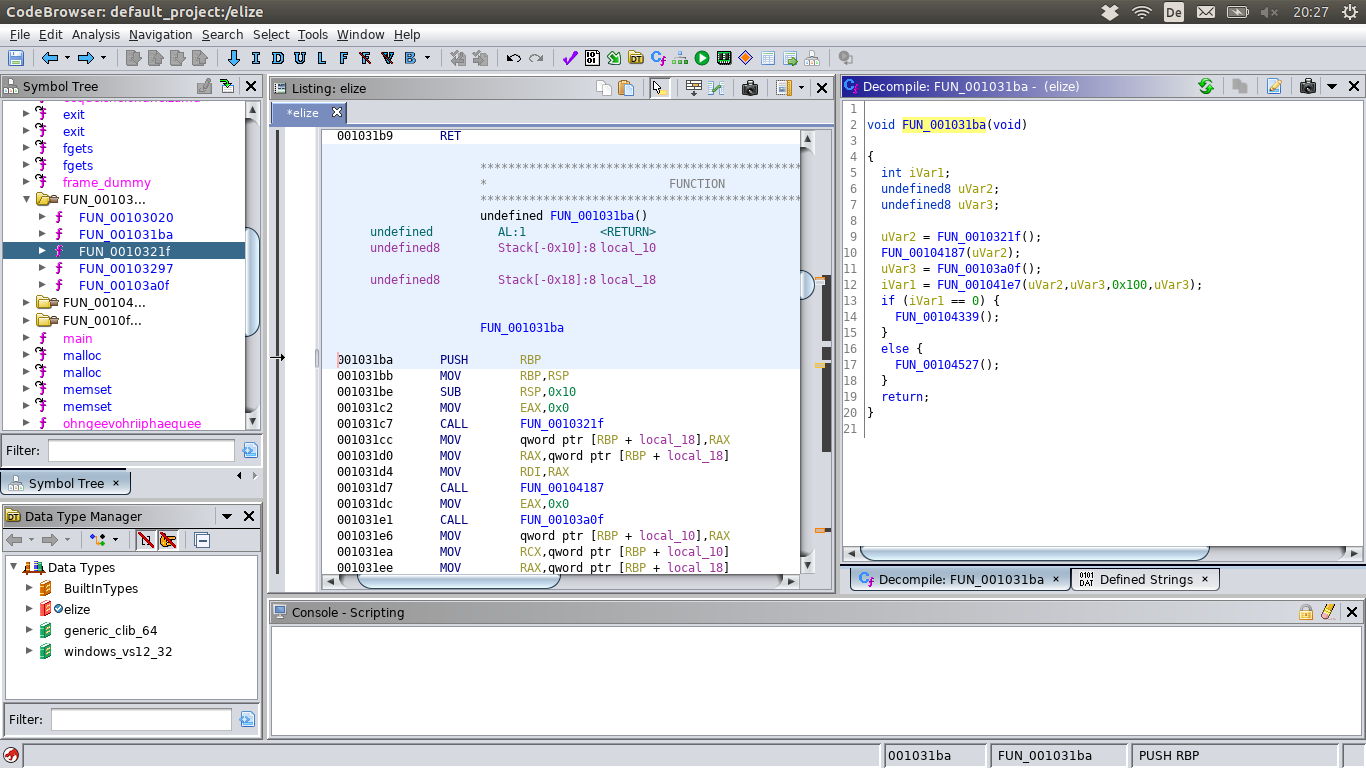 You can find the executable here.
Advantages of the script
The scripted approach has two advantages over manual dumping: First, it’s less work (once you have written the script). And second, it’s scalable: dumping the functions by hand works for this challenge only because there are only a handful of encrypted function. If there are hundreds or even thousands of functions in a binary a manual approach is no longer feasible. And the number of protected functions you may encounter in a binary in the wild will most probably be closer to a hundred than to the nine encrypted functions in this challenge.
Also, I have some hope that this script (with some adaptations) might also work against other protectors. With some modifications, it should in principle be usable against any crypter that encrypts executable code in place.